OpenTelemetry Integration With MCP Agent Pipelines
W3C trace context and OpenTelemetry conventions link agent and tool traces.
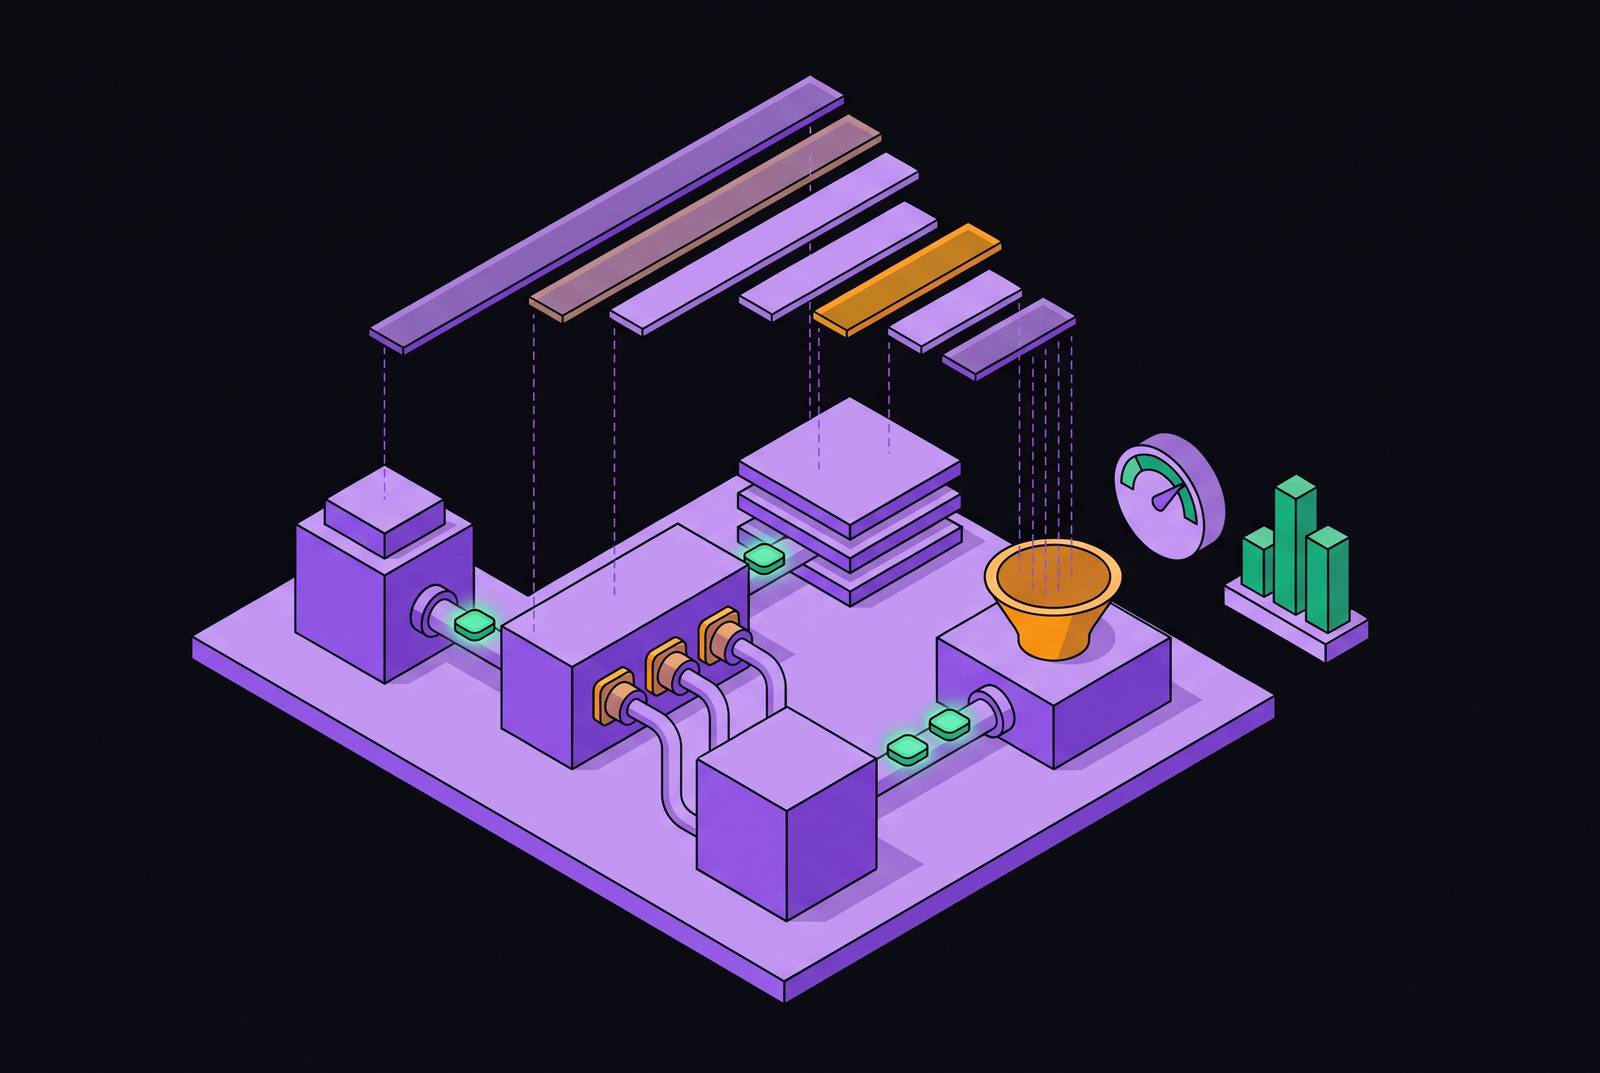
OpenTelemetry integration with MCP agent pipelines fixes a structural defect. Without shared trace context, the trace of an agent’s request is separate from the trace of the tool server’s work. W3C context propagation joins them, while OpenTelemetry conventions make the result queryable. That gives teams a record of what an agent did across process boundaries. It does not, by itself, control what the agent is allowed to do.
Why MCP agent pipelines produce broken traces without W3C context propagation
The agent process produces one trace, and the MCP server produces another. A tool call fails, but neither trace provides the chain from the original request to the failed work. Both processes can emit telemetry and still leave this gap. Without shared correlation identifiers, their records show separate events with no link to the same execution.
Fan-out makes that separation harder to untangle. One prompt can spawn many concurrent calls to tool servers running in separate processes. Timing alone cannot show which calls belong to which request, especially when several branches run at once. Correlation therefore depends on consistent context injection at every process boundary.
What the 2026-07-28 MCP specification added to fix context propagation
The 2026-07-28 MCP specification formalized W3C Trace Context propagation inside MCP request metadata. It defines the fixed keys traceparent, tracestate, and baggage in the JSON-RPC _meta object. The host injects the context, and the server extracts it to continue the trace. Downstream calls then use the same trace ID. The protocol now handles correlation, so applications no longer need a private agreement to do it.
Transport determines where that context has to travel. HTTP-based MCP transports, including SSE and Streamable HTTP, propagate trace context through standard HTTP headers. A stdio transport has no header layer. It must pass the context explicitly in the tool call’s params._meta field, so HTTP instrumentation alone cannot cover that boundary.
The specification also deprecated MCP’s own Logging capability. It redirects logging to stderr for stdio transports or to OpenTelemetry for structured observability. Those are parallel alternatives. The distinction places structured telemetry outside MCP’s former logging capability while preserving a suitable output path for stdio processes.
The InputRequiredResult flow shows why request metadata is important beyond a simple tool call. Execution can pause for human confirmation and resume through a new HTTP request on a different container. The traceparent in _meta links the resumed call to the original session, preserving the original execution context that the new request needs.
How OpenTelemetry's MCP semantic conventions define the span model
OpenTelemetry’s MCP semantic conventions give the connected trace a consistent structure. They set out the client and server span kinds, the attributes, the rules for names, and four metrics. The conventions recommend MCP-specific instrumentation rather than generic RPC conventions because MCP spans express domain context that generic RPC spans do not. Shared names make that context queryable across implementations.
The required mcp.method.name attribute identifies operations such as tools/call, tools/list, and initialize. Other key attributes include mcp.session.id, which links spans across a session, and mcp.protocol.version, which records the specification version used for the call. Span names use the pattern {mcp.method.name} {target}, which gives them names such as tools/call echo and tools/call get-sum. Elastic APM displays these as transaction names. The name identifies the operation, while the attributes preserve its session and protocol context.
The conventions define mcp.client.operation.duration and mcp.server.operation.duration for operation timing. They also define mcp.client.session.duration and mcp.server.session.duration for session timing. These provide latency baselines without custom metric definitions. Operation and session duration remain distinct, allowing the instrumentation to describe individual calls and the sessions containing them.
MCP spans also fit into the broader GenAI span model. That taxonomy includes create_agent, invoke_agent, plan, invoke_workflow, and execute_tool for agent construction, invocation, planning, multi-agent coordination, and tool execution. Duplicate tool spans would distort that hierarchy. When outer GenAI instrumentation already creates an execute_tool span, the MCP layer should add its attributes to that span. These conventions have Development status, so their names and semantics remain subject to change.
What instrumentation looks like in practice, from a single MCP server to a closed observability loop
An MCP server is a standard programmatic process. Instrumenting it requires an OpenTelemetry SDK, spans around tool handlers, and an export path to a backend. Auto-instrumentation covers the transport layer, while manual spans describe tool execution.
Elastic’s implementation uses the official @modelcontextprotocol/server-everything reference package to make that distinction concrete. It covers echo as a minimal request/response tool, get-sum as a parameterized tool, and trigger-long-running-operation as a multi-step operation that reports progress through notifications. Each handler receives a span named with the tools/call {tool-name} pattern. The instrumentation attaches mcp.method.name, gen_ai.tool.name, and gen_ai.operation.name, then closes the span when the tool completes or errors.
The export path connects the server’s SDK to an OpenTelemetry Collector and then to an observability backend. Traces describe individual tool invocations, metrics can be derived from those traces, and structured logs flow through the same collector. The collector provides a common route for these signals. It does not replace context propagation, which must already connect the work across process boundaries.
A second server, the Elastic Agent Builder MCP, exposes the APM data back to Claude Desktop. The agent can query the telemetry from its own tool calls, find slow tools, and explain what went wrong, all within the chat interface. That closes the operational loop. Trace data becomes context the agent can use while working, rather than only a dashboard a person checks afterward.
Why the Development-status caveat on semantic conventions is a planning problem, not a reason to wait
The relevant OpenTelemetry GenAI and MCP convention documents mark their status as Development. Attribute names and meanings can change, and there is no stability guarantee. That is a real dependency-management constraint. It is not the same uncertainty as having no agreed way to propagate context, because the MCP specification itself defines that protocol mechanism.
The practical response is to pin versions. Teams should build against a specific SDK and convention version, document that target, and manage convention changes as dependency upgrades. Waiting for Stable avoids possible changes later but leaves teams without correlation across process boundaries in the meantime.
Three content-capture modes for tool arguments and the privacy trade-off each one makes
OpenTelemetry marks tool argument and message attributes as opt-in because they may contain sensitive information or personal data. Full payload capture gives teams the most detail for debugging while also exposing the most data. This requires a deliberate design decision. A setting that helps explain a failed tool call can also copy the data handled by that call into another system.
The three modes are off, metadata only, and full capture. Off records no payload content, leaving method names, session identifiers, and latency without tool arguments or responses. Metadata-only capture records structural attributes such as tool name, method, and session, but excludes argument values. Full capture stores complete tool arguments and responses and requires explicit enablement. It provides the most detail, but it also creates the broadest data-handling obligation.
For implementations using full capture, the corresponding safeguards are concrete. Payloads should be stored as encrypted blobs with a defined TTL, and capture should run only when explicitly configured. Stored content should have the same access controls as personal data in the systems the agent queries. Exporting it as telemetry does not make it harmless.
Metadata-only operation still supports useful cost and token observability. Token anomalies in span attributes can expose runaway retries, prompt bloat, or unexpected tool chaining before quality metrics degrade. Cost is therefore more than a billing signal. It can reveal changes in agent behavior without recording the arguments or responses that produced them, which gives teams a useful diagnostic path without full payload capture.
What unified trace context enables for enterprise data governance and access accountability
A unified trace links the agent session, tool calls, and downstream data access through trace and span identifiers. That link makes post-call accountability possible. When an agent chains several calls to answer one question, the record can connect each call to the same user session and prompt. Without that connection, logs may show access events but not the request that caused them.
A connection to a warehouse can leave a gap in governance. An MCP server may use a service account with broad read access, so a tool call can fetch fields that the task does not need. Authorization can succeed while the retrieval is still excessive. OpenTelemetry context connects the access record to the session that triggered it.
That is why MCP tool calls should include OpenTelemetry trace and span identifiers. Column-level and row-level restrictions still belong at the data governance layer. The identifiers connect a violation, such as access to unnecessary PII columns, to the responsible tool call and session. Attribution gives enforcement and investigation a specific target. It does not substitute for the controls that restrict access.
GDPR data minimization under Art. 5(1)(c) makes this distinction operationally relevant. An AI model will pass fields available in prompt context unless the tool schema constrains them. A trace-linked access record can reveal that unnecessary personal data fields were transmitted, providing evidence for correcting that schema. Metadata can establish which session caused a call without necessarily revealing the contents of that call, so accountability depends on connecting trace context to the relevant access evidence.
What production observability looks like once the trace is unified — and the gaps that remain
A correctly connected backend can show the full execution tree. Agent invocation, tool execution, downstream API or database work, and the response appear within one span hierarchy, with timing, error codes, and session context. Slow sub-spans can then be identified programmatically. An agent with access to the backend through a second MCP server can use those records for bottleneck analysis, as Elastic demonstrates.
The same continuity applies to workflows that pause for human input. With InputRequiredResult, the resumed call’s traceparent links it to the original session even when execution moves to another container. The pause no longer breaks the execution record.
Column-level and row-level access still need data-layer controls. Data residency also needs separate attention, because MCP server logs sent from an EU deployment to a US-based SIEM may create a GDPR Chapter V transfer issue when they contain user identifiers or query parameters. Trace correlation cannot resolve that transfer question.
Complete records support the upper levels of the five-level governance maturity model, where full agent-to-API correlation and continuous compliance evidence become possible. Ungoverned servers with no trace context provide only the lowest level of visibility. A trace examined after a session ends supports a postmortem.
Real-time control requires a layer that can act before the call completes. A centralized gateway can evaluate MCP access policy against the same trace context that OpenTelemetry propagates, while data-layer controls restrict which rows and columns are available. The trace supplies visibility and attribution. Preventing an inappropriate call requires using that context while there is still time to stop it.