AI Agent Observability Tools for Enterprise MCP Environments
Gateway and SDK layers each capture what the other misses in agent activity.
Enterprise MCP observability depends on where traffic is captured. SDK instrumentation explains activity inside applications developers chose to instrument, while a gateway sees the traffic routed through it regardless of who deployed the agent. Good governance needs capture that covers enough traffic and analysis that goes deep enough to explain what happened.
Why standard application monitoring cannot answer MCP-specific questions
An agent touches a production database, but nothing in the existing monitoring stack identifies the action as agent activity. The database stays healthy. An API log records a request, yet it does not show which user sent the agent, which conversation prompted the action, or which policy allowed access.
MCP expands that gap because an agent can reach Slack, GitHub, Snowflake, production databases, and internal APIs through MCP servers. Latency and error rates show how well services run but leave out the chain of decisions across those systems. The same prompt can also lead to different tool choices depending on context. A bad outcome may have no error code and only come to light days later. Datadog’s MCP security guidance recommends capturing tool registrations, configuration changes, and invocations, including parameters and errors, giving teams evidence that ordinary infrastructure traces miss.
What MCP observability actually needs to capture to be useful
For buyers, the first test is whether a tool captures both halves of an agent run. The model half includes requests, prompts, parameters, completions, tokens, latency, and errors. The action half includes which MCP tools ran, which servers they reached, and each call’s duration and error type. Neither half stands alone. Both need a session and an owner so an investigator can connect a model response to an action and identify who or which agent caused it.
That trail must identify the initiating user or agent, the MCP client or host, and the server being accessed. It must show which tool, prompt, or resource was invoked and keep the request parameters and response metadata. Access decisions belong in the same record. Authentication, authorization, policy checks, filters, denials, and modifications explain why an action proceeded or stopped. Sensitive data handling must also be visible, including whether PII or secrets were detected, blocked, redacted, or allowed through.
Coverage comes before dashboard depth in this evaluation. Even a full record of a small slice of traffic leaves holes in the audit trail. Timing, usage patterns, and compliance records become useful only when the relevant activity reaches the capture point. Open export through OTLP, GenAI semantic conventions, and Prometheus keeps that evidence portable across backends. For regulated prompt data, self-hosted, in-VPC, or on-prem deployment may be a prerequisite.
The architectural split that determines what any tool can actually see
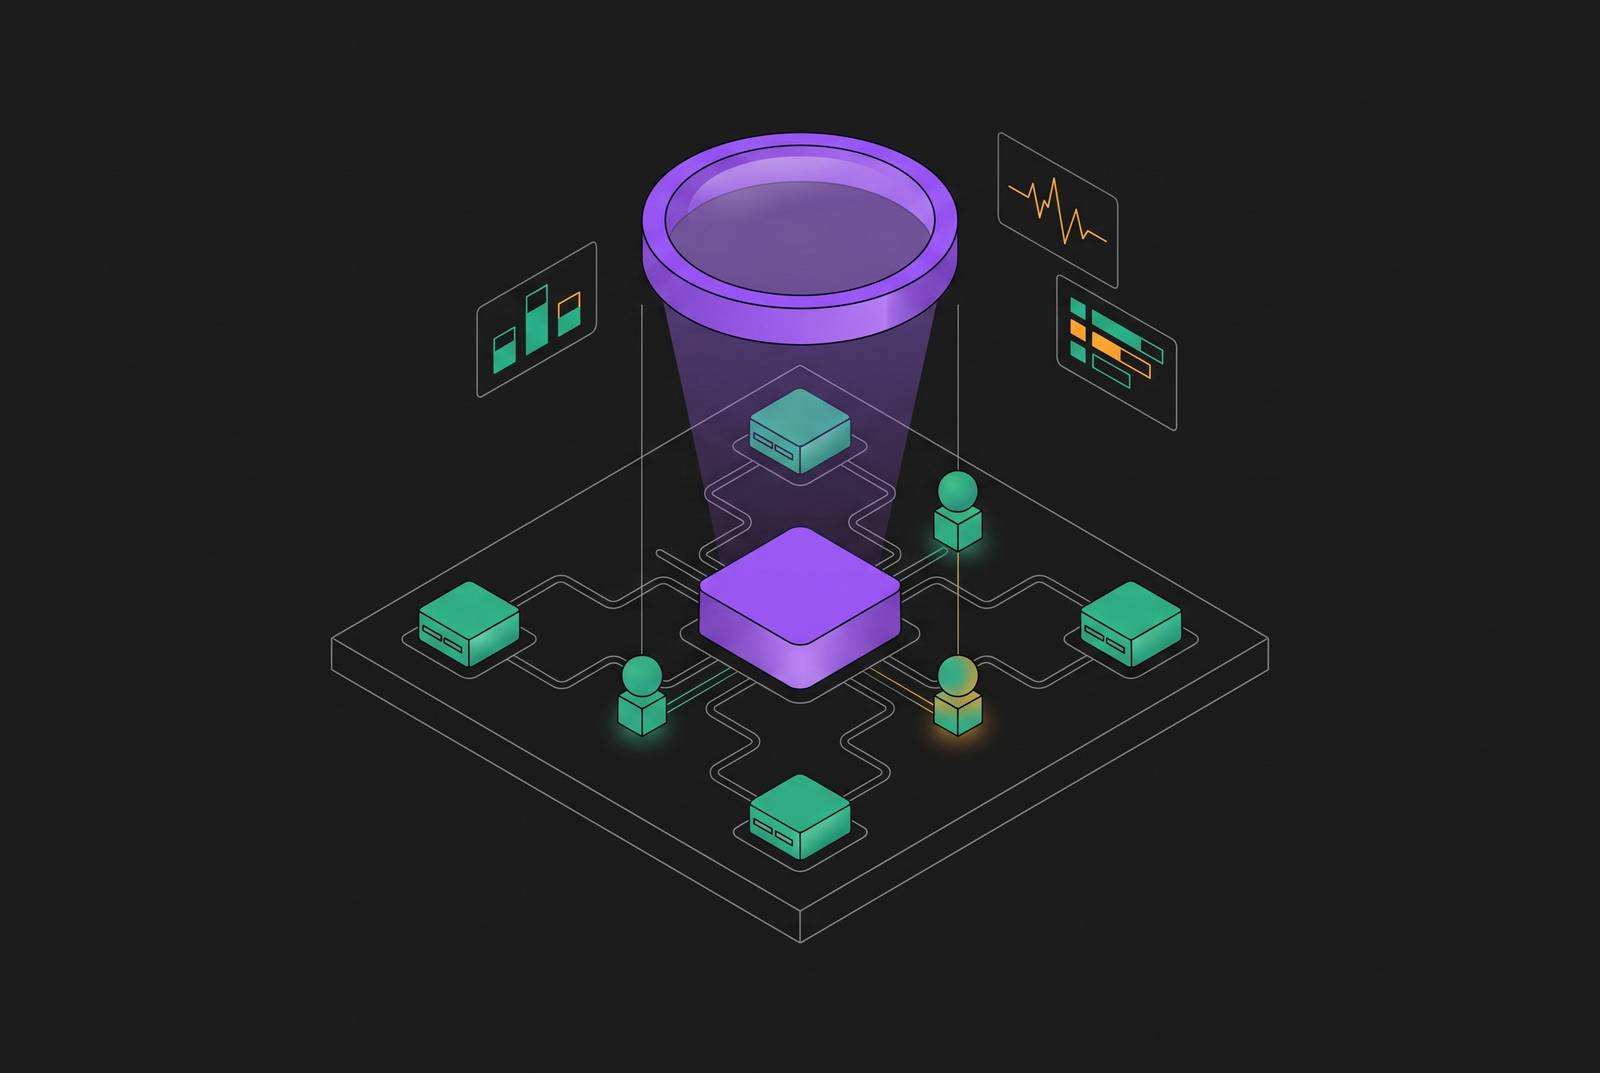
SDK-layer capture puts instrumentation inside each application. It produces rich in-app traces, but its boundary is the application someone chose to instrument. Gateway-layer capture takes place in the request path. Picture an agent sending a request through a gateway to an MCP server, with the gateway as the single point that sees every crossing. When all MCP traffic follows that path, capture does not depend on the agent’s framework or on application code changes.
An SDK inside one application cannot observe a coding agent on a developer’s machine or an employee-installed AI app outside that application. Enterprise traffic includes all of those sources. A gateway in their request path can also capture the sequence across multiple MCP servers, which isolated per-server instrumentation cannot reconstruct on its own.
OpenTelemetry provides a common language for connecting these layers. Its MCP semantic conventions include mcp.method.name and mcp.session.id, although they remain at Development stability. Enterprises can use a gateway for raw capture and an analysis backend for deeper investigation. These are two different jobs, capture coverage and analytical depth. Conflating them produces dashboards that may explain individual runs well while showing only part of the estate.
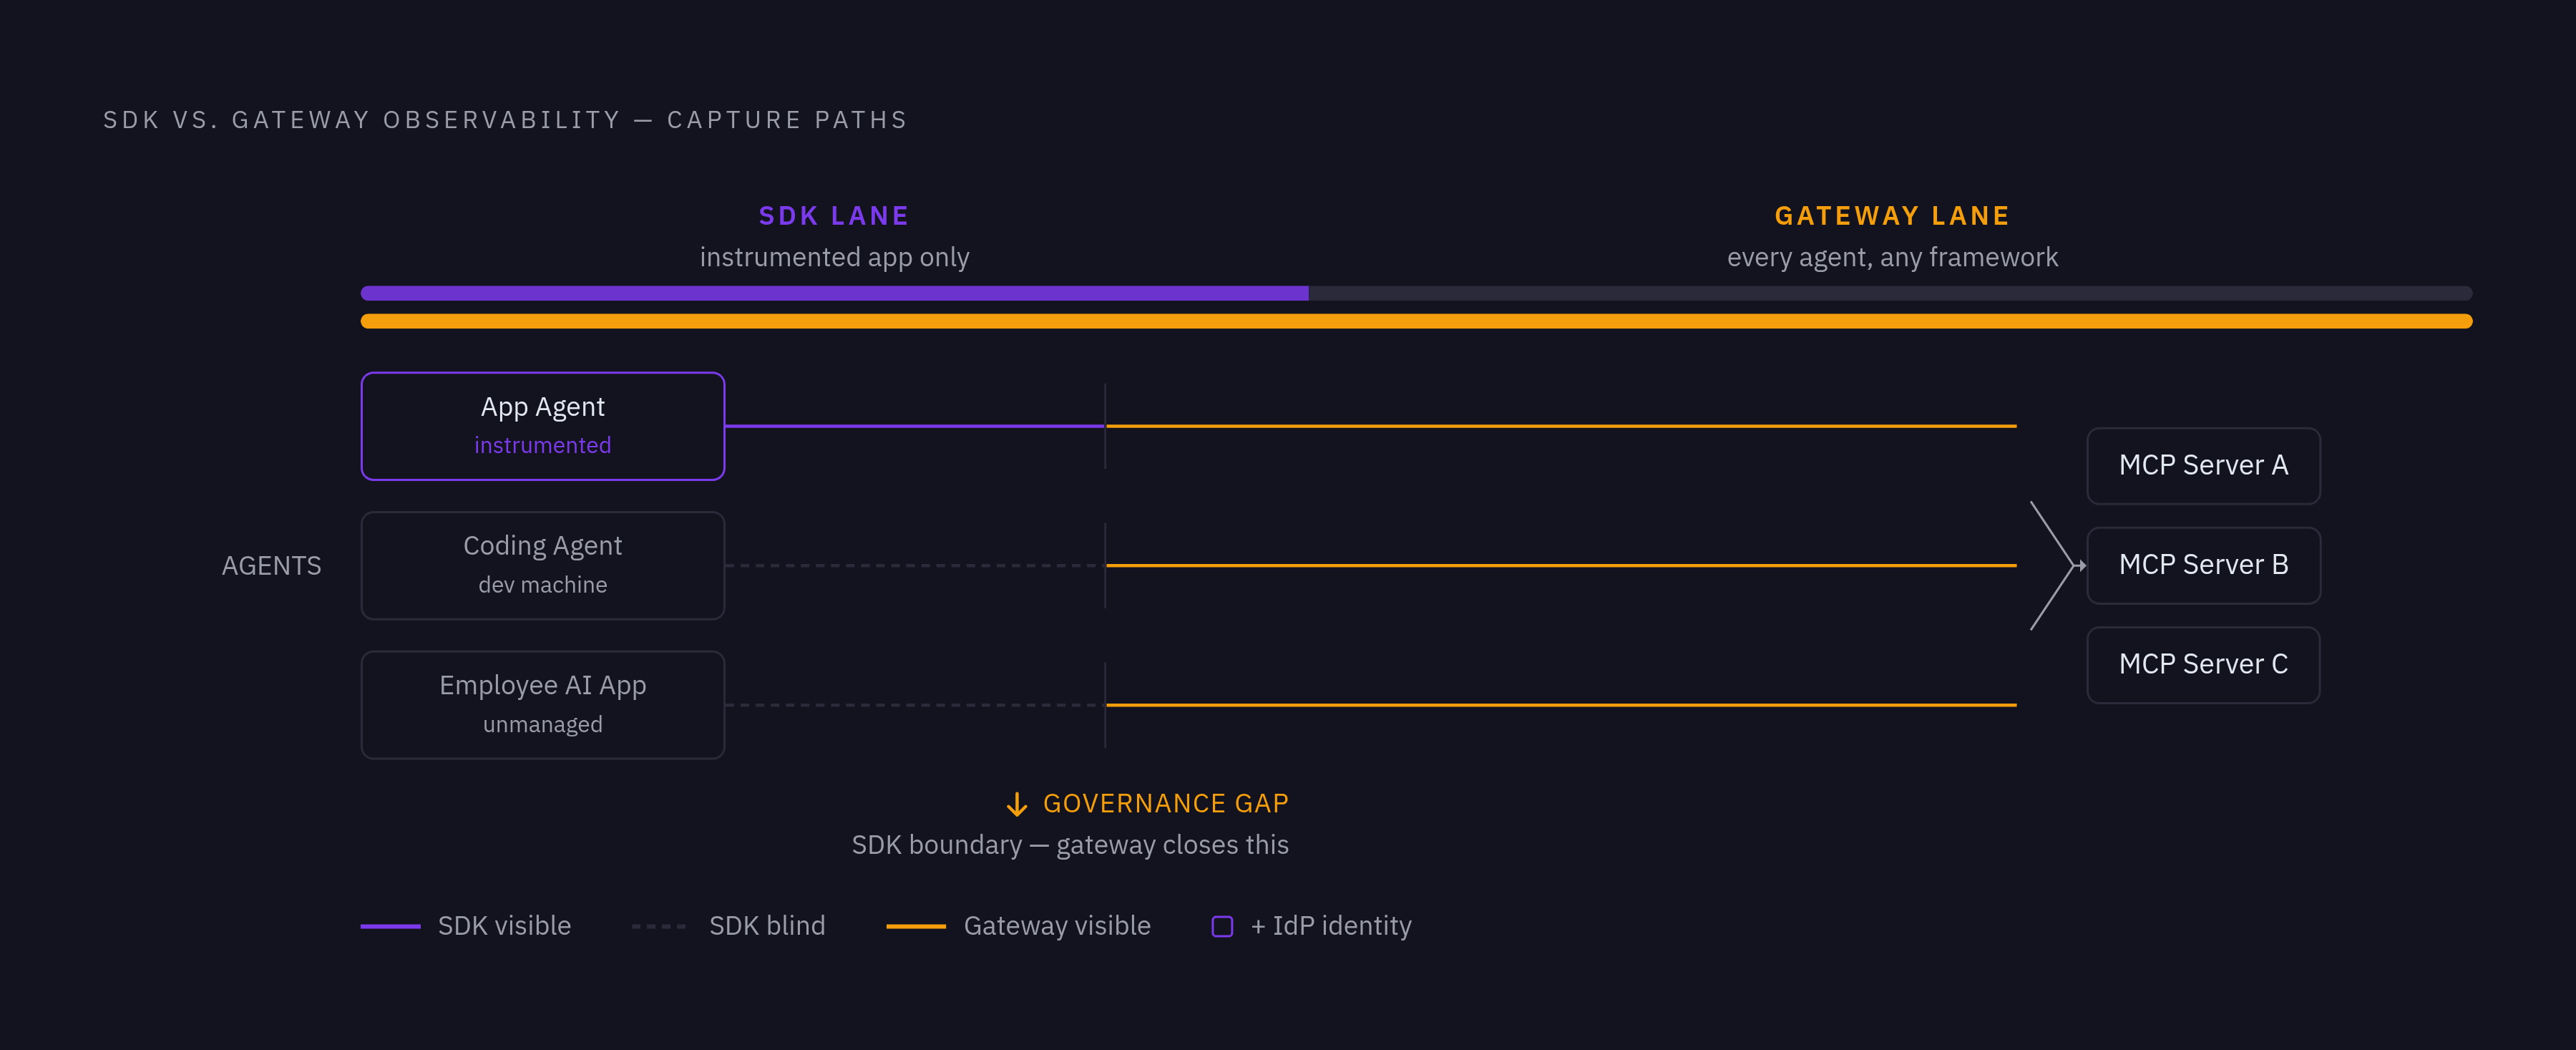
What gateway-layer tools capture and where they fall short on analytical depth
Bifrost, the open-source AI gateway built by Maxim AI, records LLM requests and MCP tool calls routed through it without application code changes. It can capture traffic no matter which model is used. It groups Claude Code, Codex CLI, or OpenCode activity into a trace using the session header those agents already send. Team and virtual-key labels, plus exports to Prometheus, OpenTelemetry backends, and Datadog, make that traffic available for downstream analysis.
Its MCP gateway records sessions, tool calls, and tokens as they happen and attributes them to a named person, team, and agent. It resolves identity against the organization’s IdP rather than accepting an application’s self-reported identity. That difference is significant for audit evidence. A coding agent on a developer’s machine becomes visible when its traffic crosses the gateway, even if no developer added an observability SDK to it.
Raw traffic alone lacks the quality scoring, evaluation pipelines, or semantic failure detection needed to tell whether an agent did what it set out to do. A tool call can succeed and still lead to a wrong outcome. Gateway exports therefore supply evidence to analytical tools.
What SDK-layer and instrumentation-based tools deliver where gateways cannot go
Arize Phoenix builds on OpenTelemetry’s GenAI semantic conventions for trace-level agent observability. Langfuse links traces through context propagation so that activity between the client and server appears as one end-to-end flow, and it has a native MCP server. Langfuse’s commercial boundaries also affect evaluation. Audit logs need higher-tier plans, but HIPAA guarantees, with a BAA available, start at Pro and are also available at Enterprise.
Datadog LLM Observability captures MCP client session initialization, tool invocations, and error codes. The client session sits inside a workflow span, while individual calls appear as tool spans. It also supports OTel GenAI conventions. For teams already using Datadog APM, this offers a way to consolidate monitoring vendors. That consolidation should not be confused with proof of equivalent depth in semantic failure discovery or multi-step causal analysis.
Braintrust supports deep analysis through Brainstore, its database for high-scale, deeply nested AI traces. Its MCP server lets teams query logs, pull experiment results, and run comparisons from compatible clients, including Cursor, Claude Code, and VS Code. Analysis can stay inside the editor. The buyer trade-off is cost at volume, because storage-based pricing can grow quickly with multi-step agent traces. IDE access to observability data does not itself provide universal capture of IDE agent activity.
Fiddler AI organizes traces from application to session to agent to trace to span, giving investigators a hierarchy for drilling down. Grafana Cloud’s MCP Observability dashboard covers protocol health, tool analytics, and performance through the OpenTelemetry-native OpenLIT SDK. Maxim AI traces inputs, tools invoked, and outputs across user and third-party interactions, with real-time alerts for missed performance thresholds. Their usefulness still depends on capture coverage.
The shadow MCP problem and why coverage gaps become governance failures
Shadow MCP takes shape when developers install local servers, teams connect agents to SaaS applications, and employees make internal tools available through custom servers. Each connection may serve a legitimate purpose. Together, they create a distributed access layer with inconsistent logging and unclear ownership. Device scanning helps inventory local agent client configurations across tools such as Claude Code, Claude Desktop, Codex, Cursor, and VS Code. That inventory answers a question a tracing dashboard cannot settle on its own, namely which MCP servers people are running.
The documented risks extend beyond missing logs. They include sensitive data exfiltration, unauthorized actions, over-privileged access, supply-chain exposure, missing audit trails, privilege escalation, and shadow AI sprawl. Named vulnerabilities make the exposure concrete. CVE-2025-59944 concerns case-sensitivity-bypass-based MCP configuration tampering in Cursor IDE. CVE-2025-6514 is a remote code execution vulnerability in mcp-remote with a CVSS score of 9.6, affecting hundreds of thousands of downloads.
OWASP lists prompt injection as LLM01 in its Top 10 for LLM applications, with indirect prompt injection as one variant. In MCP environments, malicious instructions can arrive in retrieved web pages, documents, or emails without an attacker speaking to the model directly. Normal retrieval becomes the entry point. Without observability during the event, organizations lack the evidence needed to detect misuse as it unfolds, investigate suspected exfiltration afterward, or demonstrate compliance. A server absent from the registry also leaves ownership and identity unaccounted for, turning a coverage gap into an audit gap.
How regulatory requirements map onto the two-layer observability architecture
The ICO’s 2026 guidance requires a DPIA for agentic deployments assessed as likely to create a high risk to individuals’ information. Multi-step reasoning and cross-agent handoffs complicate that assessment because activity crosses application boundaries. SDK traces explain the instrumented portions. Gateway capture tied to identity gives a broader trail of access when those interactions pass through it. The two layers therefore contribute different evidence to an assessment of how personal information is used.
GDPR and CCPA obligations also reach the observability data itself. Deletion pipelines must account for PII in agent logs, training data, and the original business system. Erasure needs an access trail. Knowing which agent accessed which data, and where the resulting records went, requires more than isolated application traces. Gateway identity and access records help track that data, and exported data in analytical backends must also be covered by deletion.
Where consent is required, the system must block agent access to data for users who have not opted in. A later log review is too late. MCP servers can enforce granular access controls, masking, and rate limiting because they explicitly define the resources and tools exposed to agents. Governance practices also call for least privilege tied to identity, data classification, and redaction or egress filtering before sensitive content goes into model context.
The EU AI Act adds enforcement and Article 50 transparency requirements as the majority of its provisions apply from 2 August 2026. India’s Digital Personal Data Protection Act imposes consent requirements with significant penalties, while Singapore released an agentic AI governance framework in January 2026. Requirements differ across jurisdictions. MCP’s official 2026 roadmap reflects the same enterprise pressure by identifying audit trails, SSO-integrated authentication, gateway controls, and configuration portability as gaps. Capture architecture supports these obligations, but a gateway alone does not establish legal compliance.
How to match observability architecture to what your enterprise agent estate actually looks like
Teams whose entire agent traffic flows through controlled, instrumented applications can get meaningful observability from SDK-layer tools alone. That boundary is the deciding condition. Once coding agents, developer-installed MCP servers, or employee-installed AI apps operate outside it, a gateway capture point becomes a prerequisite for broader visibility. The analytical backend can only investigate the evidence it receives.
Teams should narrow the choices based on where tools can run before they compare features. Air-gapped requirements or strict data residency rules rule out SaaS-only options that cannot meet those needs. For most enterprise environments, the resulting design combines a gateway, an analytical backend, and a server registry. Each has a distinct job. The gateway captures identity-bound activity and exports it in open formats, the backend provides investigation and evaluation, and the registry accounts for the servers agents can reach.
The governance value comes from treating that gateway as a control point. Approved access paths give people less reason to make shadow connections. When governed routes are available, teams can take up MCP quickly and still keep new tools in view.