MCP Observability Stack Design for Production Agents
Autonomous agents need tool-call tracing, access logging.
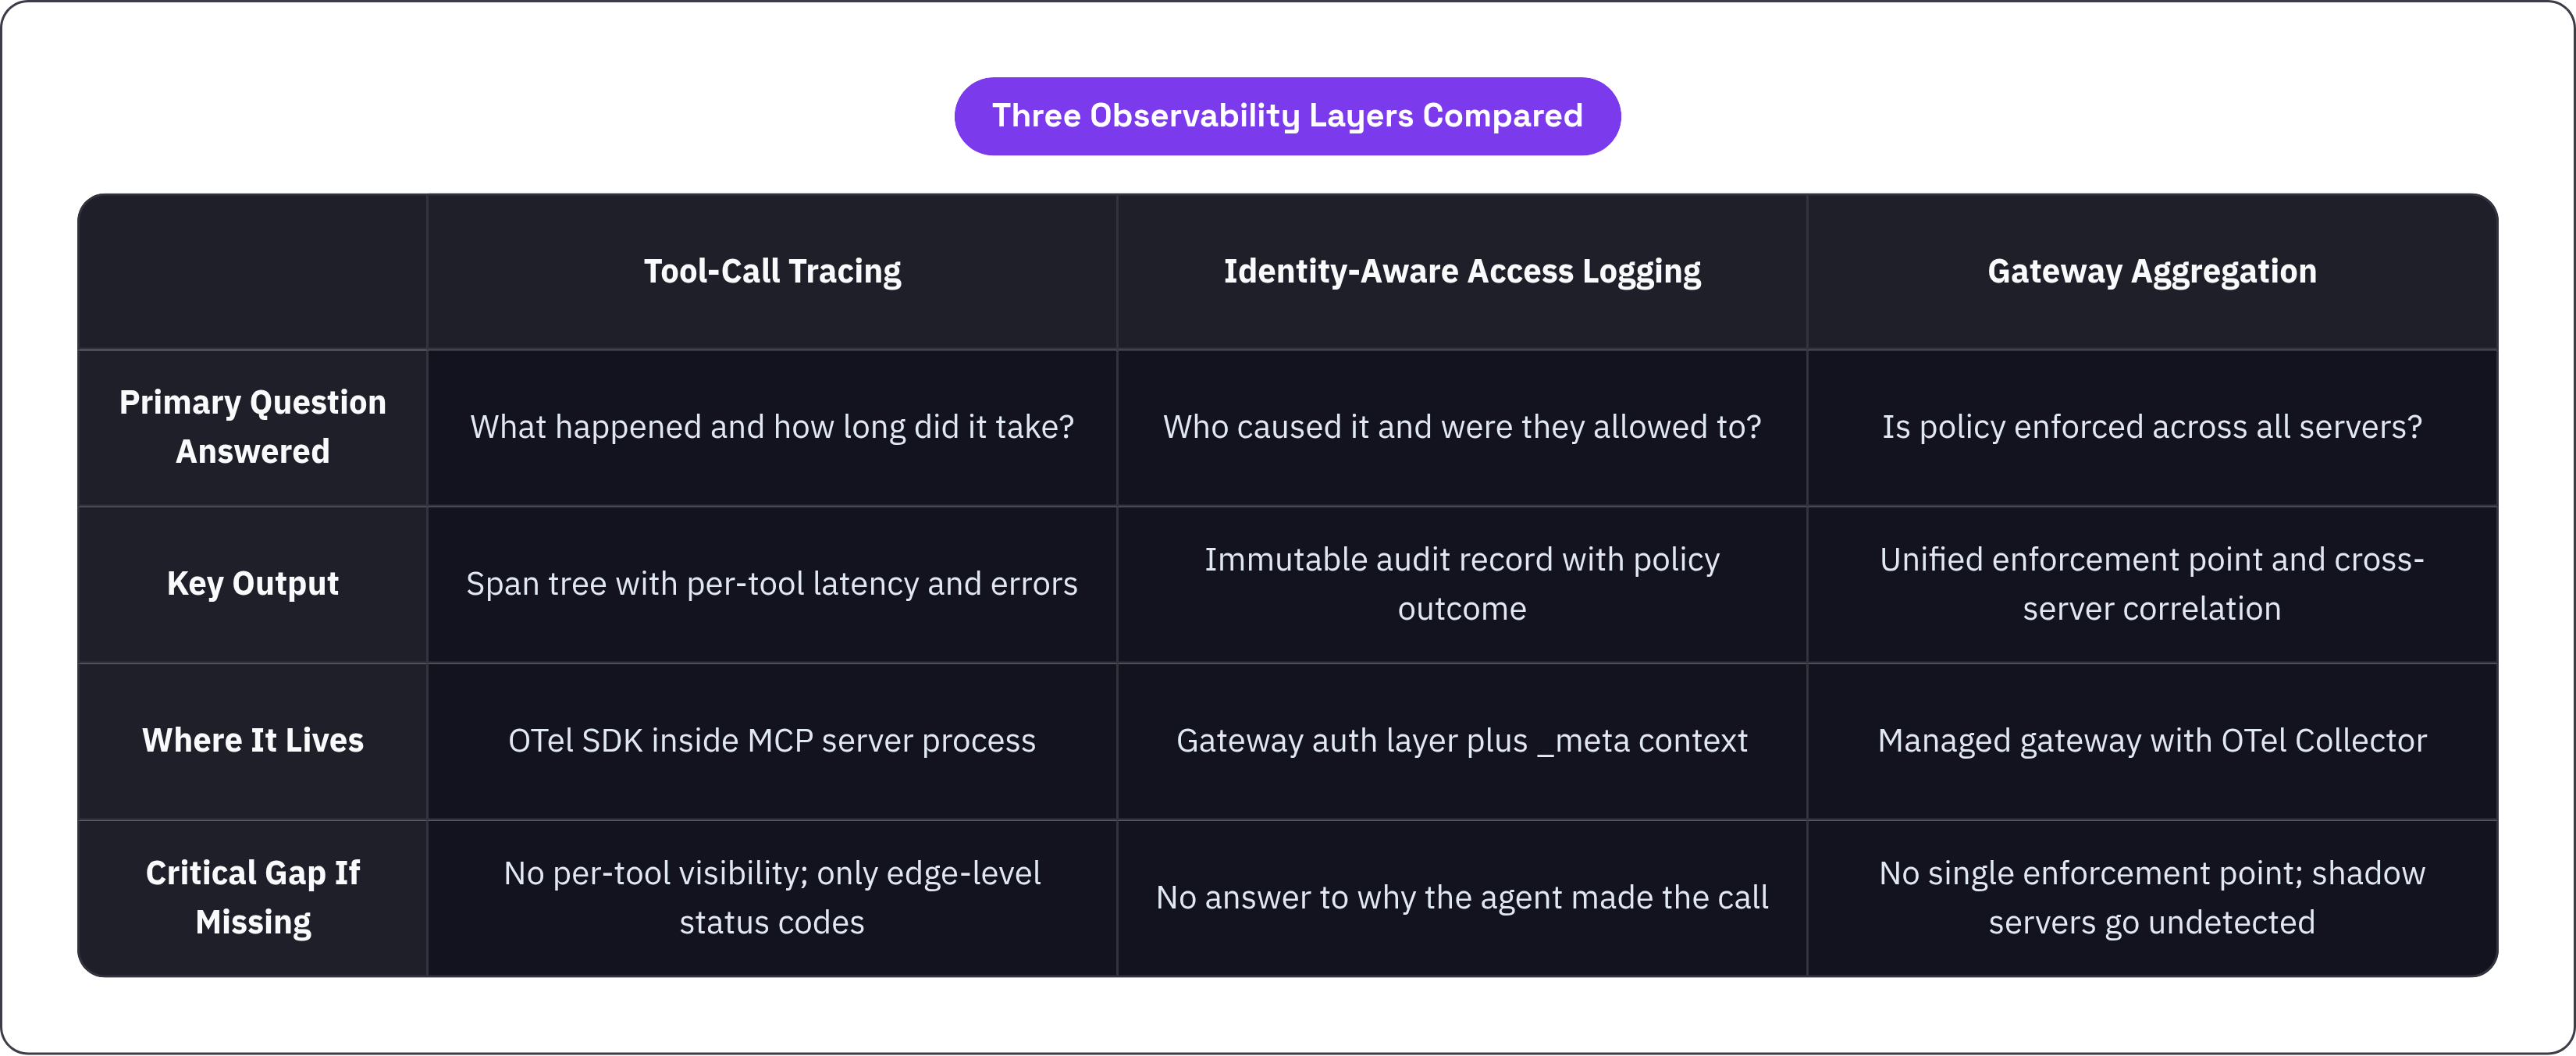
MCP agents pick up tools and run them mid-conversation, with nobody standing over their shoulder checking each step. That's the whole problem in a nutshell, and, it's why observability here means something different than it did a year ago. A production agent stack needs three layers pulling together: tool-call tracing, identity-aware access logging, and a gateway that ties both into a record you can actually hand someone later. Miss one of the three and you get a gap, and ungoverned access just sits there in that gap, unnoticed, sometimes for weeks.
The instinct to bolt standard API monitoring onto this runs into a fundamental mismatch. It watches latency and status codes at the edge. It has no idea which tool the model picked, what arguments it passed, or why it picked that tool over the other three it could've called. A request can come back 200 OK while quietly deleting a production table, and your dashboard stays green the whole time. That's not a theoretical edge case; it's the kind of failure that shows up in incident reviews.
Two kinds of failure slip through, and, they don't look anything alike. On the SRE side: bursty agent traffic causing cascading latency, token budgets running dry mid-session, cold starts, cache-miss patterns that never show up in an aggregate error rate because the aggregate hides them. On the governance side: an autonomous decision touches a sensitive system and nobody can tell you, six hours later, whether a user actually asked for that or a prompt injection triggered it. The MCP roadmap itself names end-to-end visibility, in a form enterprises can actually feed into compliance pipelines, as an open problem that remains unsolved.
So, this isn't a monitoring upgrade you slot in next quarter. It's the control surface that makes autonomous agent behavior visible, and answerable, to a person.
What the MCP protocol itself now provides as observability primitives
The July 2026 release candidate moves the ground under this a little. MCP goes stateless: no more sticky sessions, no more shared session stores that made gateway inspection brittle every time someone touched the load balancer config. That shift unlocks more than it sounds like it should.
A round-robin load balancer can now look at each request on its own, without correlating anything against a session store somewhere. Traffic routes on the Mcp-Method header, which gives the gateway a clean hook for attaching policy and logging to specific operation types. Clients cache tools/list responses using the server's ttlMs, so the tool inventory holds still long enough that logging against it actually means something.
The real workhorse in the spec is SEP-414: W3C Trace Context propagation through the _meta field. It locks in fixed key names, traceparent, tracestate, baggage, so traces line up across SDKs and gateways without anyone hand-rolling glue code at 2am. A trace that starts in the host application follows a tool call through the client SDK, into the MCP server, out into whatever that server calls downstream, and lands as one span tree in any OpenTelemetry-compatible backend.
Treat an MCP server like a peer service in its own right, because that's what SEP-414 assumes you'll do. It gets its own service.name, its own spans, and joins the host's trace by trace_id. The host records the orchestration; the server records what it actually did; the exporters stitch the two together afterward. What the spec doesn't hand you: identity context you'd put in front of an auditor, policy enforcement, or one place to aggregate everything. Those are stack design problems, and nobody's shipping that part for you, so I wouldn't hold my breath waiting for the spec to grow it.
The OpenTelemetry vocabulary for MCP tool calls and agent spans
OpenTelemetry's GenAI semantic conventions give you the actual words for instrumenting agents and tools. As of the v1.42.0 extraction in June 2026, this lives in its own repository, open-telemetry/semantic-conventions-genai, split off from core OTel proper.
Two namespaces carry the load: gen_ai. covers agent inference spans, model calls, and token events, while mcp. covers tool execution specifically. An MCP tool call sits in the same trace vocabulary as the agent that called it, not off in some separate system nobody ever cross-references.
Four agent span types show up in the spec: createagent, invokeagent, invokeworkflow, executetool. invokeagent gets marked CLIENT when the agent runs remotely, behind a managed API say, and INTERNAL when it runs in-process. That distinction matters once you're trying to attribute cost and latency correctly instead of eyeballing it. executetool is where your MCP tool call spans actually live; that's what you instrument for per-tool latency and error tracking.
Worth flagging before it costs you a Friday afternoon: every genai.* attribute still carries a "Development" stability badge as of mid-2026, and none are Stable yet. Run this in production without setting OTELSEMCONVSTABILITYOPTIN=genailatestexperimental, and you're stuck on frozen v1.36-era attribute behavior while thinking you're on current.
There's a duplicate-span bug worth knowing about too. Run GenAI instrumentation and MCP instrumentation side by side, and the same tool call shows up twice in your trace. The fix doesn't live in the collector, tempting as that is. It's upstream, in MCP instrumentation that checks for an existing outer GenAI span and appends its attributes there instead of spinning up a second one.
Adoption, at least, isn't a problem. Datadog, Google Cloud, AWS, and Azure all map gen_ai.* attributes into their own schemas, so instrumentation written against this vocabulary flows into most enterprise backends without a translation layer in the middle.
Layer one: real-time tool-call tracing at the server and SDK level
The topology here is simple: AI Agent, MCP Client, MCP Server, Tools. The OTel SDK sits in the server process, emitting traces, metrics, and logs, which flow through an OTel Collector into whatever backend you've settled on.
Every tool invocation should produce a trace covering three things. The tool call itself, the execute_tool span, with arguments captured but scrubbed of secrets and PII before any of it leaves the process. Any downstream work the server does on the tool's behalf, database queries, API calls, file reads, as child spans in the same tree. And, the outcome, categorized as success, tool-defined error, or transport error, not flattened into one generic "error: true" that tells you nothing.
At minimum, the SDK layer should emit latency histograms per tool name, p50, p95, p99. A bimodal distribution there is usually a downstream dependency problem, a cache-miss pattern, or a connection pool running dry, and you want to know which before it pages someone at midnight. Track invocation counts per tool so hotspots surface before they turn into an incident, and break error counts out by category instead of lumping them together. And, count tokens in and out per execution, because that's the foundation for any cost attribution you'll want to do six months from now when finance starts asking questions.
FastMCP ships with built-in OTel instrumentation covering all MCP operations out of the box, which is a reasonable place to start if you're building a new server and don't want to write this plumbing from scratch.
This layer catches performance regressions, error spikes tied to one tool, runaway token spend, downstream dependencies quietly falling over. What it doesn't tell you is who authorized the call, under what policy, or whether the agent had any business making it in the first place.
Layer two: identity-aware access logging and what it adds that traces alone cannot provide
A trace tells you what happened. That's not the same question as who caused it, and, it's definitely not the same as whether they were allowed to. You need both records, and neither one substitutes for the other, no matter how detailed the trace gets.
Every logged tool call needs identity riding along with it. The authenticated principal: which agent, which user, which service account made the call. The policy that governed it: which RBAC rule let it through or blocked it cold. The MCP server's verified identity, not self-reported; an unregistered server is an identity nobody's accounting for, full stop. And, the origination signal, meaning whether this came from a direct user instruction, an autonomous model decision, or something that smells like a prompt injection dressed up as a legitimate request.
That last one is the real difference between MCP access logging and standard API audit logging. A standard audit log answers who, what, when, where. MCP logging has to answer why the agent decided to call this tool in the first place, which is a much harder question and one most existing tooling was never built to ask.
SSO-integrated enterprise auth is a named gap on the MCP roadmap right now, not yet formalized in the spec itself. Until that changes, identity context gets injected at the gateway and carried through _meta or request headers into the trace.
RBAC for agents isn't about locking things down for its own sake. It's how "here's what this agent is allowed to do" becomes a decision someone actually made, on purpose, instead of whatever the default happened to permit. Logging is how you check, later, that the decision held at runtime and didn't just look good on paper.
Timing matters here more than people expect. A log that flags a policy violation after the tool call already ran is fine for a postmortem, and postmortems have their place. A log that blocks the call before it executes is the actual safety net, so logging and enforcement need to sit right next to each other; neither one should be waiting around on the other to catch up.
Layer three: the gateway as the aggregation and enforcement point
Practitioner consensus in 2026, reflected in AWS, Microsoft, and the MCP roadmap itself, is that governance belongs at the infrastructure layer, not scattered across a dozen individual servers hoping each author gets the security logic right on their own. Every tool call should pass through a managed gateway, and that's not a nice-to-have anymore.
Server-level instrumentation can't give you a single enforcement point for auth, policy, and redaction. A gateway can, and that's the whole reason it exists in this architecture. It gives you cross-server correlation too, since it sees which agent hit which tools across multiple servers in a single session, tying together spans that look unrelated from any one server's narrow vantage point. It's where the registry of known MCP servers lives; without a registry entry, a server is invisible to governance, full stop. And, it's where redaction happens before telemetry leaves the building, since the OTel Collector at the gateway is the right spot to strip secrets and PII while keeping the trace correlation IDs intact.
AWS MCP Gateway, open source under Apache 2.0, launched May 2025, is a solid reference point: OpenTelemetry as its single instrumentation surface, emitting OTLP traces and metrics. Microsoft's Foundry unified MCP endpoint is the production example at real scale, a single front door aggregating many MCP servers while centralizing governance, identity, and observability under one roof.
This is the layer where enterprises need an actual control plane for MCP access, with the controls and observability that separate a real production deployment from something running without governance.
Two deployment patterns come up in practice. Agent-mode collectors, co-located with each server instance, give you low latency and work fine for smaller setups. A centralized collector, taking in OTLP from every gateway-instrumented server and enriching, transforming, and exporting from one place, scales better once you're correlating across servers at enterprise volume.
One more thing the gateway does, almost as a side effect: it's where shadow MCP adoption gets caught, because a server running outside the registry doesn't show up anywhere in this layer, and that invisibility is itself the tell.
Wiring the three layers together: how trace context flows end to end
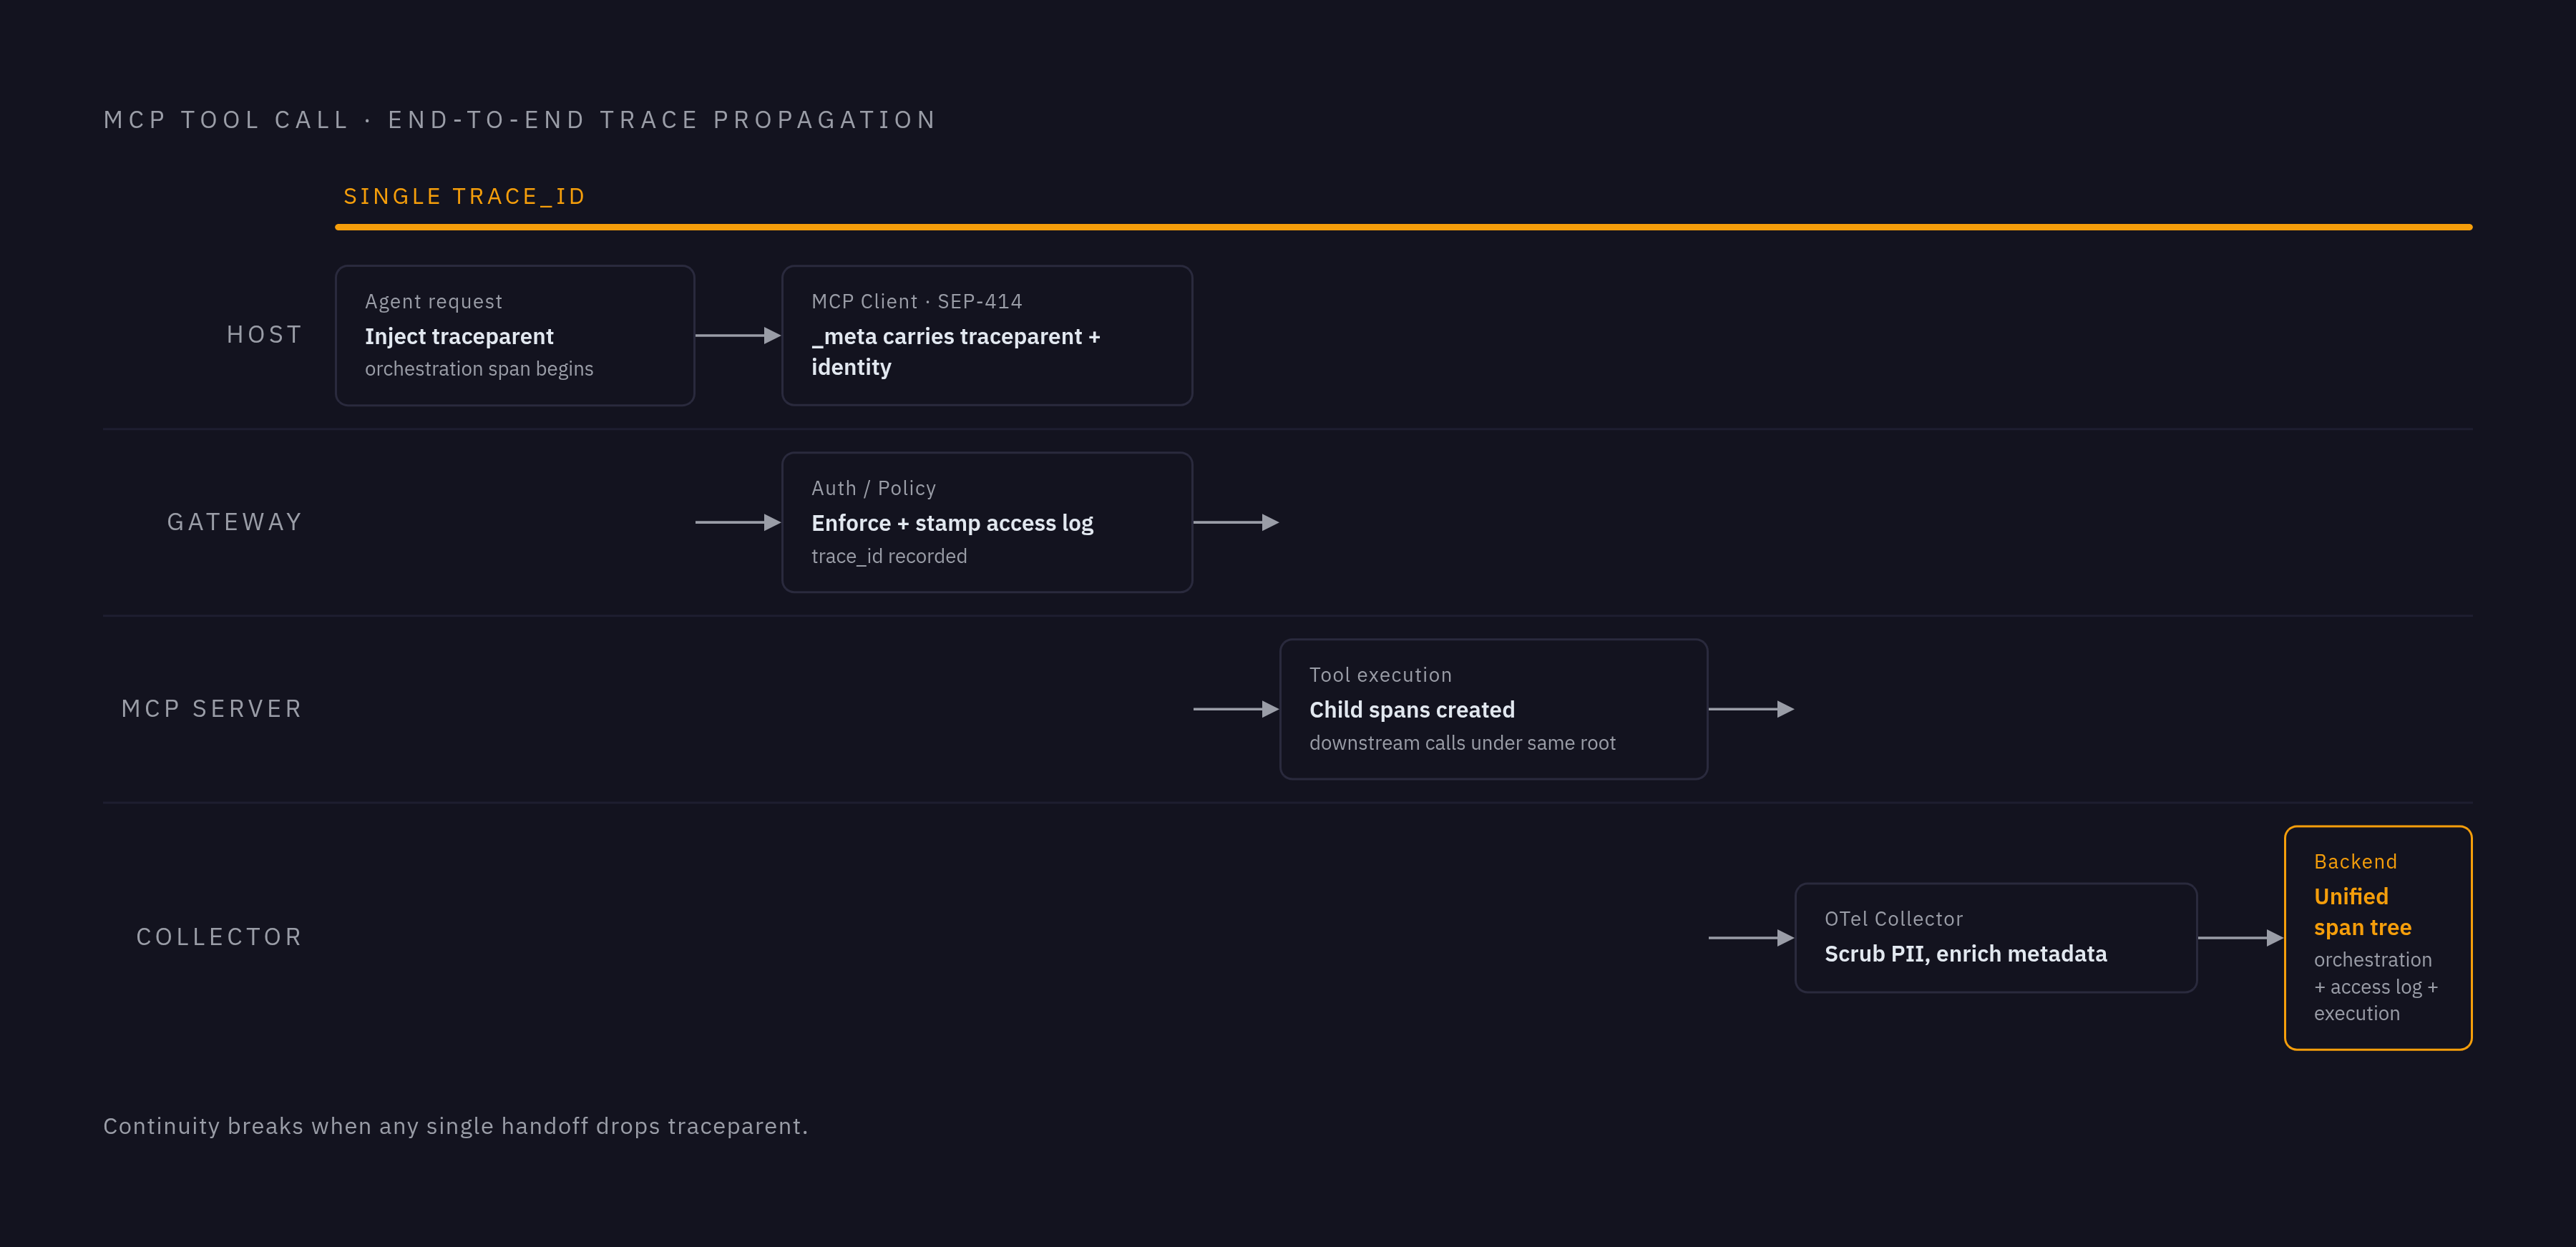
Follow one tool call from start to finish. The host application creates a root span and injects a traceparent into the agent request. The MCP client carries that traceparent, plus identity context, forward in meta per SEP-414. The gateway receives the call, enforces auth and policy, stamps the access log with identity and the policy outcome, then forwards it to the server with trace context untouched. The server creates child spans for its own tool execution and downstream work, logging arguments, redacted, and the outcome. The OTel Collector at the gateway pulls in OTLP from every server, scrubs PII, enriches with registry metadata like server identity and policy tags, and exports to the backend. What comes out the other end is one full span tree: orchestration spans from the host, the access log from the gateway, execution spans from the server, all under a single traceid.
The baggage field is the right spot for identity and policy context that every layer needs to read, without shoving any of it into the MCP payload where it doesn't belong.
The wiring breaks in a few predictable places, and Each of these failure modes shows up in practice. Instrumentation that builds spans but forgets to inject traceparent into outbound calls snaps the tree immediately, right at that seam. Gateways that strip or rewrite _meta sever the link between host and server traces entirely, and you usually don't notice until the day you go looking for something specific and it's just not there. Collectors that scrub correlation IDs along with the PII they're supposed to redact cause a quieter version of the same failure; you have to redact the value and keep the ID, and that takes actual discipline, not a default someone flipped once during setup and forgot about. The duplicate-span issue from overlapping GenAI and MCP instrumentation gets fixed at the SDK config level, not by patching the collector after the fact, tempting as that shortcut looks at 3pm on a Friday.
The stateless protocol landing in the July 2026 RC makes all of this hold together better than it used to. No sticky sessions means every request is independently inspectable right at the gateway, and the collector isn't stuck reconstructing session state just to figure out which spans belong to which call.
Audit-grade versus SRE-grade telemetry and why the same pipeline must serve both
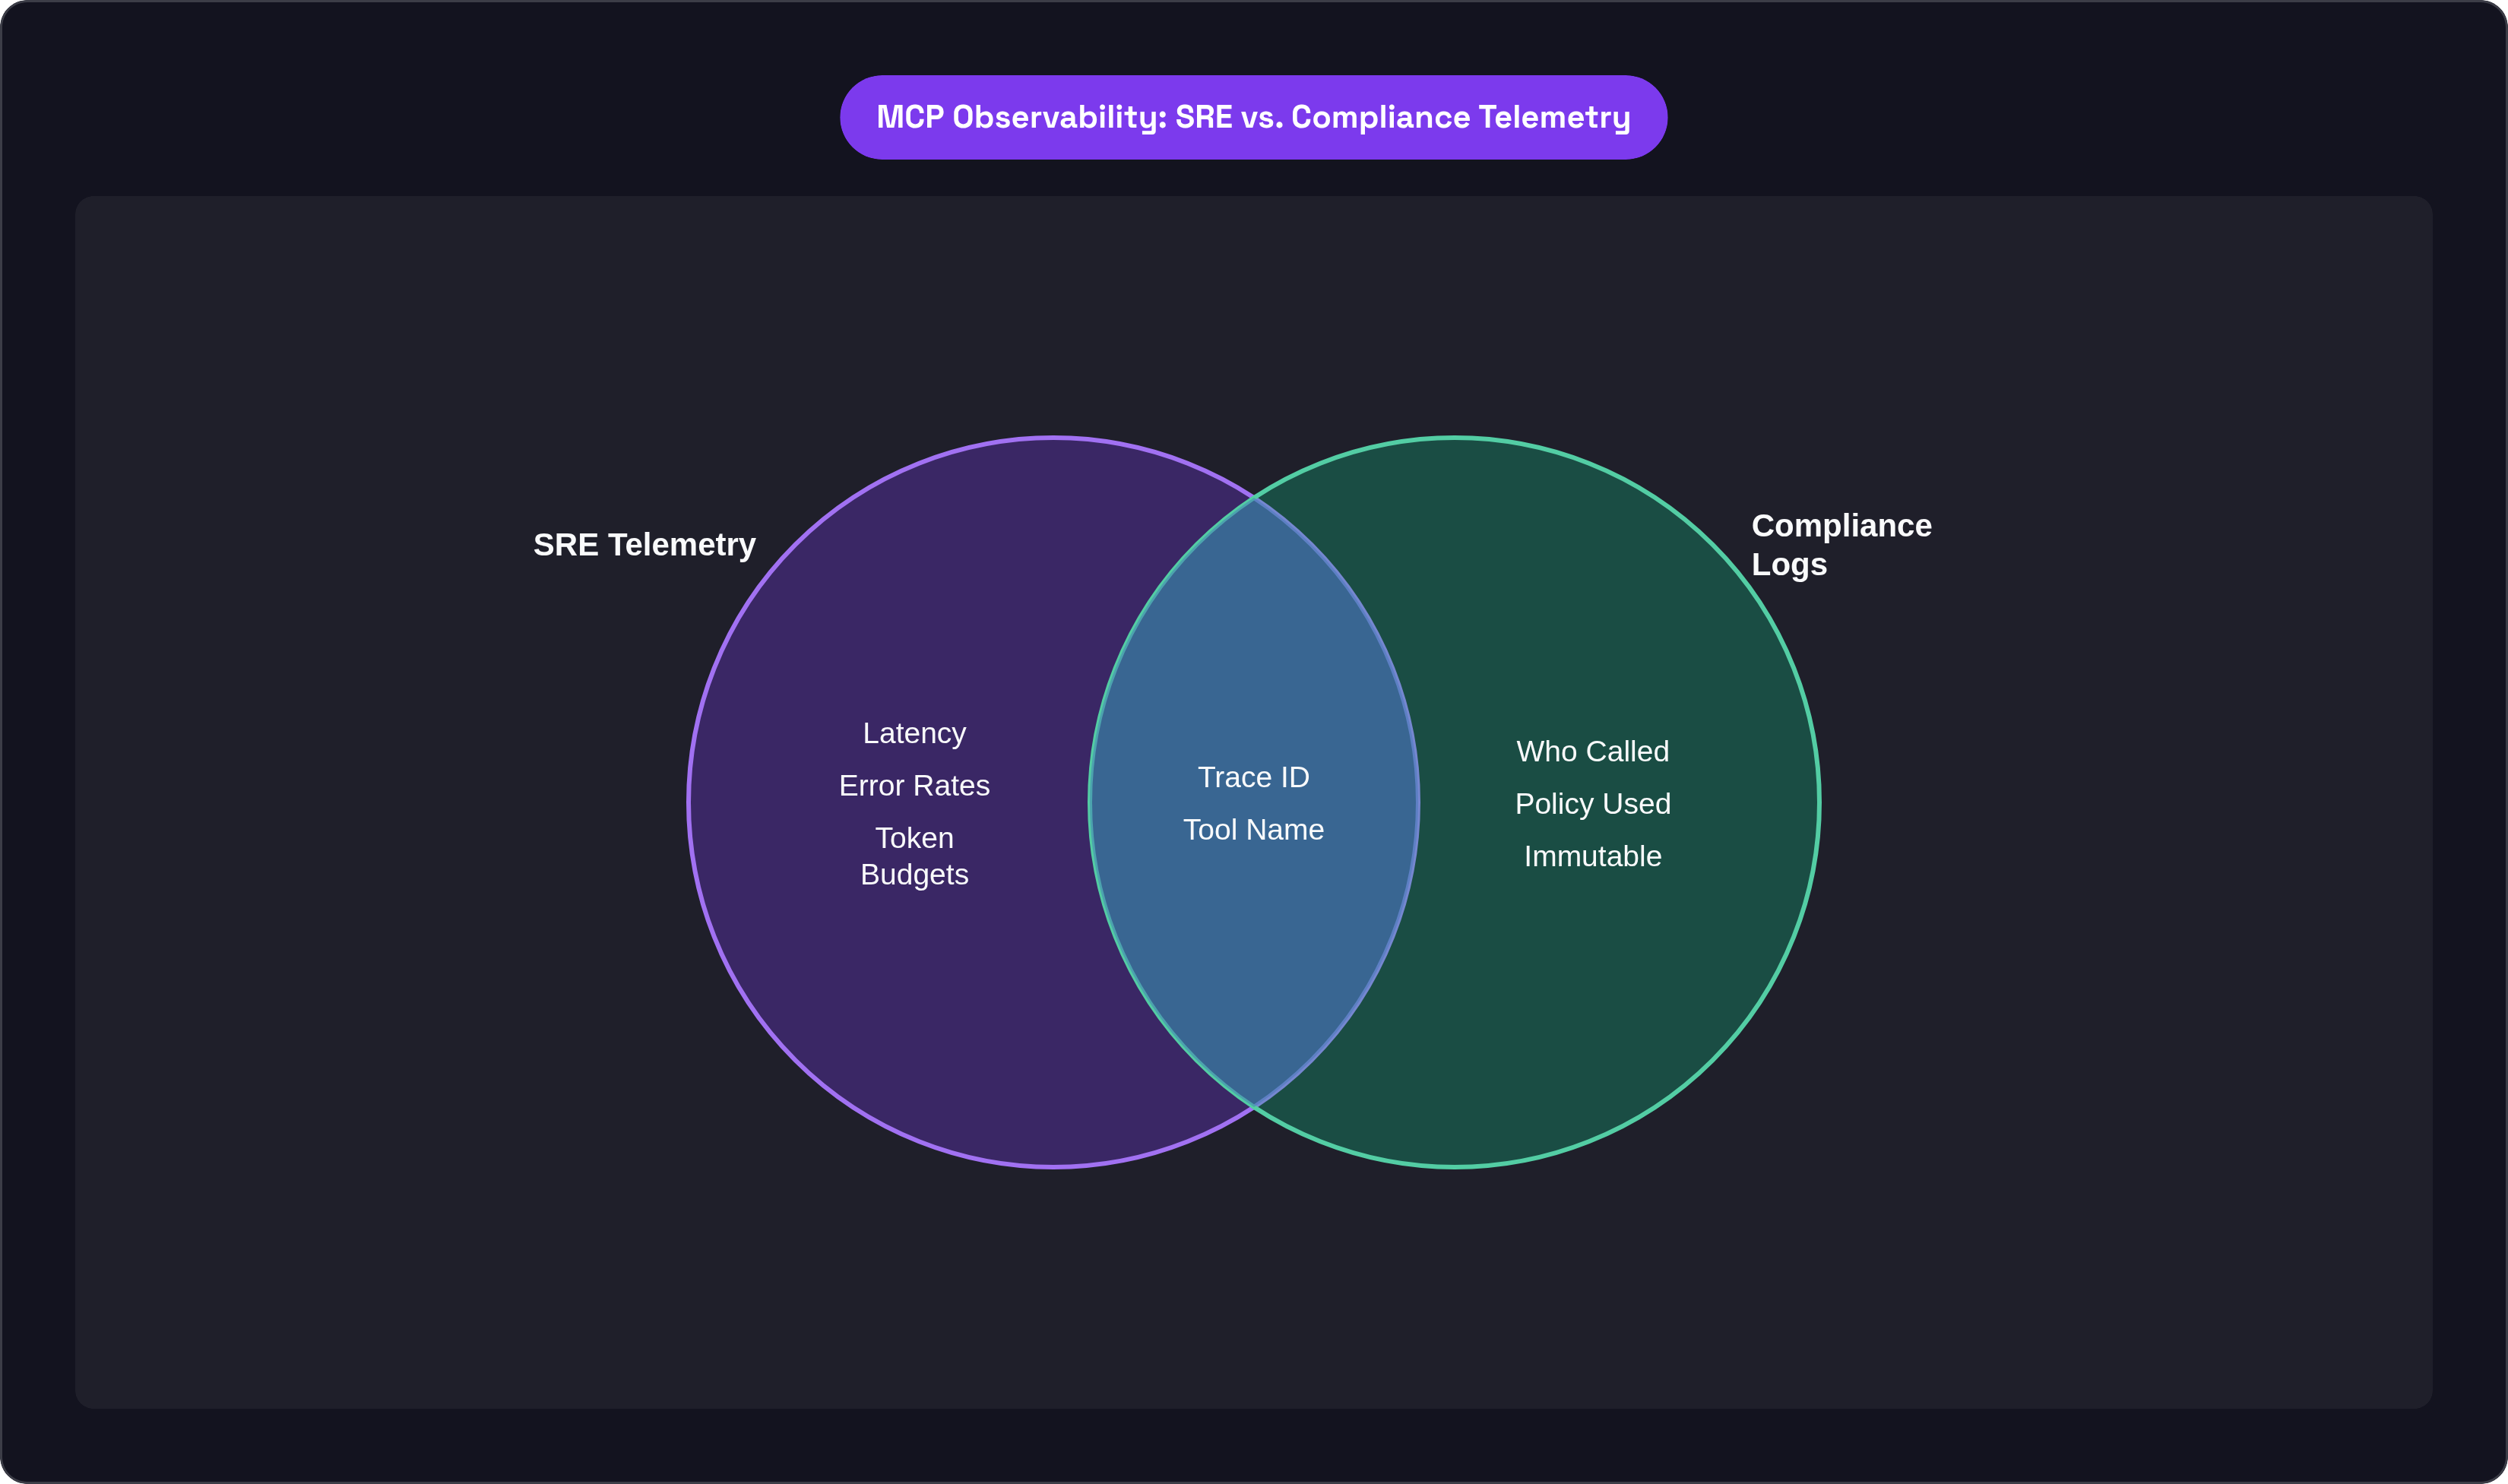
Two audiences read this telemetry, and, they want fairly different things out of it. SRE and platform teams want latency percentiles, error rates, which tools are running hot, whether token budgets are burning too fast, cost per agent or per user or per tier, cache hit rates. Operational health, that's the whole ask.
Compliance and security teams want something else. Who called what, under what policy, with what arguments, and what instruction started the chain in the first place. That record has to be immutable and tamper-evident, because someone outside engineering is going to ask for it eventually, and "we think this is probably what happened" doesn't survive an actual audit.
Here's where teams get it wrong, and I've watched this happen more than once: they build two separate pipelines, one for each audience, run by two separate teams who don't talk much. If the SRE trace and the compliance log come from different collection paths, they drift apart, timestamps stop lining up, and tool names get normalized differently somewhere along the way. And, on the one day you actually need to reconstruct an incident end to end, the two records don't agree with each other, and now you've got a credibility problem on top of the original one.
One pipeline, two views, that's the fix. The traces from layer one, the identity context from layer two, the enforcement record from layer three: all of it lands in the same store, tagged so each audience queries what it needs without anyone reconciling three competing versions of the truth after the fact.